- Syrian Arab Republic
- Afghanistan
- Albania
- Algeria
- American Samoa
- Andorra
- Angola
- Anguilla
- Antarctica
- Antigua and Barbuda
- Argentina
- Armenia
- Aruba
- Australia
- Austria
- Azerbaijan
- Bahamas
- Bahrain
- Bangladesh
- Barbados
- Belarus
- Belgium
- Belize
- Benin
- Bermuda
- Bhutan
- Bolivia
- Bosnia and Herzegovina
- Botswana
- Bouvet Island
- Brazil
- British Indian Ocean Territory
- Brunei Darussalam
- Bulgaria
- Burkina Faso
- Burundi
- Cambodia
- Cameroon
- Canada
- Cape Verde
- Cayman Islands
- Central African Republic
- Chad
- Chile
- People's Republic of China
- Christmas Island
- Cocos (Keeling) Islands
- Colombia
- Comoros
- Republic of the Congo
- Democratic Republic of the Congo
- Cook Islands
- Costa Rica
- Cote D'Ivoire
- Croatia
- Cuba
- Cyprus
- Czech Republic
- Denmark
- Djibouti
- Dominica
- Dominican Republic
- Ecuador
- Egypt
- El Salvador
- Equatorial Guinea
- Eritrea
- Estonia
- Ethiopia
- Falkland Islands (Malvinas)
- Faroe Islands
- Fiji
- Finland
- France
- French Guiana
- French Polynesia
- French Southern Territories
- Gabon
- Republic of The Gambia
- Georgia
- Germany
- Ghana
- Gibraltar
- Greece
- Greenland
- Grenada
- Guadeloupe
- Guam
- Guatemala
- Guinea
- Guinea-Bissau
- Guyana
- Haiti
- Heard Island and McDonald Islands
- Holy See (Vatican City State)
- Honduras
- Hong Kong
- Hungary
- Iceland
- India
- Indonesia
- Islamic Republic of Iran
- Iraq
- Ireland
- Italy
- Jamaica
- Japan
- Jordan
- Kazakhstan
- Kenya
- Kiribati
- North Korea
- South Korea
- Kuwait
- Kyrgyzstan
- Lao People's Democratic Republic
- Latvia
- Lebanon
- Lesotho
- Liberia
- Libya
- Liechtenstein
- Lithuania
- Luxembourg
- Macao
- Madagascar
- Malawi
- Malaysia
- Maldives
- Mali
- Malta
- Marshall Islands
- Martinique
- Mauritania
- Mauritius
- Mayotte
- Mexico
- Micronesia, Federated States of
- Moldova, Republic of
- Monaco
- Mongolia
- Montserrat
- Morocco
- Mozambique
- Myanmar
- Namibia
- Nauru
- Nepal
- Netherlands
- New Caledonia
- New Zealand
- Nicaragua
- Niger
- Nigeria
- Niue
- Norfolk Island
- The Republic of North Macedonia
- Northern Mariana Islands
- Norway
- Oman
- Pakistan
- Palau
- State of Palestine
- Panama
- Papua New Guinea
- Paraguay
- Peru
- Philippines
- Pitcairn
- Poland
- Portugal
- Puerto Rico
- Qatar
- Reunion
- Romania
- Russian Federation
- Rwanda
- Saint Helena
- Saint Kitts and Nevis
- Saint Lucia
- Saint Pierre and Miquelon
- Saint Vincent and the Grenadines
- Samoa
- San Marino
- Sao Tome and Principe
- Saudi Arabia
- Senegal
- Seychelles
- Sierra Leone
- Singapore
- Slovakia
- Slovenia
- Solomon Islands
- Somalia
- South Africa
- South Georgia and the South Sandwich Islands
- Spain
- Sri Lanka
- Sudan
- Suriname
- Svalbard and Jan Mayen
- Eswatini
- Sweden
- Switzerland
- Syrian Arab Republic
- Taiwan, Province of China
- Tajikistan
- United Republic of Tanzania
- Thailand
- Timor-Leste
- Togo
- Tokelau
- Tonga
- Trinidad and Tobago
- Tunisia
- Türkiye
- Turkmenistan
- Turks and Caicos Islands
- Tuvalu
- Uganda
- Ukraine
- United Arab Emirates
- United Kingdom
- United States of America
- United States Minor Outlying Islands
- Uruguay
- Uzbekistan
- Vanuatu
- Venezuela
- Vietnam
- Virgin Islands, British
- Virgin Islands, U.S.
- Wallis and Futuna
- Western Sahara
- Yemen
- Zambia
- Zimbabwe
- Åland Islands
- Bonaire, Sint Eustatius and Saba
- Curaçao
- Guernsey
- Isle of Man
- Jersey
- Montenegro
- Saint Barthélemy
- Saint Martin (French part)
- Serbia
- Sint Maarten (Dutch part)
- South Sudan
- Kosovo
General Info
Geographical Information
Population Information
Agricultural Information
Economic Information
Tax Information
Holidays and Working Hours
 General Info
Introduction
Syria, or (officially: the Syrian Arab Republic), is an Arab country, consisting of 14 governorates, whose capital and largest city is Damascus. Located within the Middle East region in Western Asia; It is considered a strategic location since it is bordered to the north by Turkey, to the east by Iraq, to the south by jordan, and to the west by Palestine, Lebanon,and the Mediterranean Sea that is considered a waterfront to reach many countries in North Africa and Europe,, with an area of 185,180 square km, and varied topography and vegetation and animal cover, and a climate ranging between Mediterranean and semi-arid. Syria ranks alongside Iraq as the oldest site of the cradle of human civilization, and the city of Damascus is considered the oldest city in the world
CapitalDamascus
Largest GovernorateHoms
Governorates14 governorates: Damascus, Aleppo, Homs, Hama, Lattakia, Deir-ez-Zor, AL-Sweida, Al-Raqqa, Hasaka, Rural Damascus (Rif Dimashq), Daraa, Idlib, Tartus and Quneitra
Country ISO 3166 CodeSY
Currency code ISO 4217 SYPSYP
Driving SideRight
Time ZoneSummer: from April to end of october (UTC+3 GMT) / Winter: from November to end of march (UTC+2 GMT)
International Phone Code00963
Cities Phone codeDamascus 011, Aleppo 021, Homs 031, Hama 033, Lattakia 041, Deir-ez-Zor 051, AL-Sweida 016, Al-Raqqa 022, Hasaka 052, Daraa 015, Edlib 023, Tartous 043, Quneitra 014
Internet TLD.sy
Geographical Information
Location and Area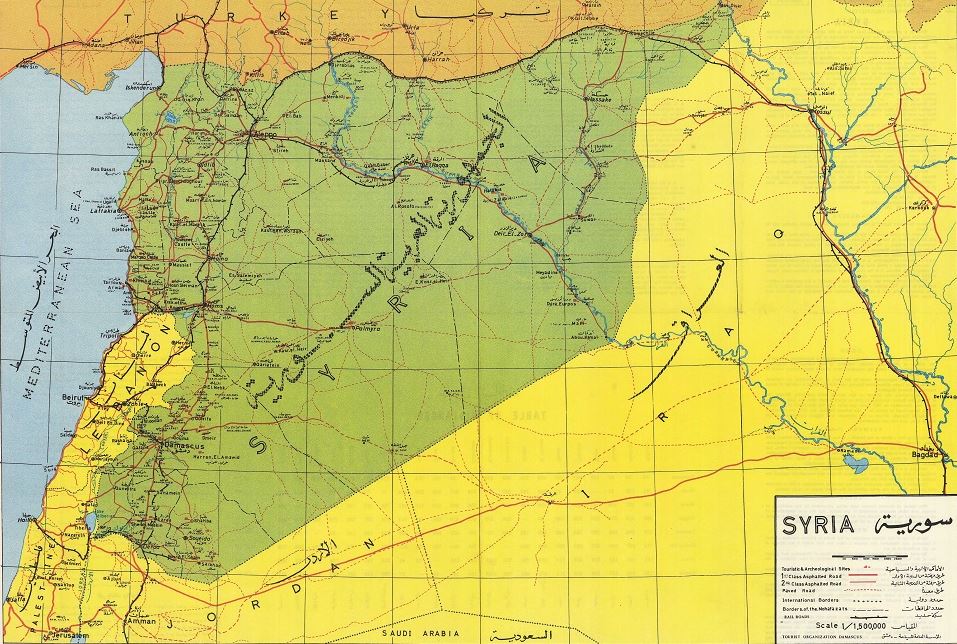 Climate
The Syrian Arab Republic is located on the eastern coast of the Mediterranean, bordered by Turkey to the north, Iraq to the east, Jordan to the south, and Palestine, Lebanon, and the Mediterranean Sea to the west.
The total area of the lands of the Syrian Arab Republic is 18,517,971 hectares (equal 185,180 Square km), of which about six million hectares (equal 60,000 Square km) are arable land, and the rest are mountains, Forests and Meadows, deserts and rivers and lakes.
The Syrian Badia is suitable for grass growing and used as pastures when enough amount rain falls.
Total
185,180
Land
183,629
Water
1551
Length of Boundaries
Coastline
Mediterranean: 183 KM
Land
Turkey: 845 KM
Iraq: 596 KM
Jordan: 356 KM
Lebanon: 359 KM
Palestine: 74 KM
Iraq: 596 KM
Jordan: 356 KM
Lebanon: 359 KM
Palestine: 74 KM
Mostly, the Mediterranean climate prevails in Syria, which is characterized by rainy winters and dry summers, interspersed with two short transitional seasons.
Population Information
Population
22.1
Population Growth
2.45%
Population Density
119
| Governorate - In Million | *.No | Percentage |
| Damascus | 2.08 | 9.40% |
| Aleppo | 3.96 | 17.92% |
| Rural Damascus | 3.20 | 14.47% |
| Homs | 1.73 | 7.82% |
| Hama | 2.08 | 9.40% |
| Lattakia | 1.31 | 5.92% |
| Idleb | 1.13 | 5.11% |
| AL-Hasakeh | 1.80 | 8.14% |
| Deir-Ez-Zor | 1.20 | 5.42% |
| Tartous | 1.15 | 5.20% |
| cities.Al-Raqqa | 0.91 | 4.09% |
| Daraa | 0.93 | 4.18% |
| AL-Sweida | 0.53 | 2.40% |
| AL-Quneitra | 0.12 | 0.53% |
| Total | 22.1 | 100% |
Nationality
Syrian
Official Language
Arabic (Official)
Business Languages
Arabic
English
French
Agricultural Information
Overview
Arable Land And Non-Arable Land
Animal Production by product
Syria is an agricultural Country. Throughout History, Syria relies on agriculture to meet its food needs and benefits from the diversity of its seasonal crops, As it witnesses the production of many agricultural products throughout the year. The number of agricultural products in Syria exceeds 70 agricultural and animal products that are produced annually. These agricultural products are considered an important factor in the food processing industries (such as: confectionery products, dairy products, food powders, dried fruits, Qamar Al-Din And sweets, etc..), It is also used in the manufacture of textiles and clothing (cotton threads, wool, ready-made clothes, etc...).
Agriculture currently constitutes 14% of GDP at constant prices and 41% of GDP at current prices. Work is now focused on developing this sector due to its importance in terms of food self-sufficiency, and for the entry of these products into the food manufacturing industries.
Arable Land And Non-Arable Land
Arable Land
6,070,445
Non-Arable Land
3,674,052
Irrigated Land
1,013,141
Actually Planted Land
4,268,925
Forests And Meadows
8,773,474
Non-Irrigated Land
3,255,784
Land Use
Agricultural And Animal Production
Cereals Production in metric ton
Legumes Production In metric Ton
Vegetable Production in metric ton
Fruits and Nuts Production in metric ton
Olive Production in metric ton
| Date | Olives |
| 2015 | 913,300 |
| 2016 | 668,441 |
| 2017 | 849,919 |
| 2018 | 664,643 |
| 2019 | 844,316 |
Industrial Corps
Cotton Production In metric Ton
| Date | Cotton |
| 2015 | 130,500 |
| 2016 | 40,700 |
| 2017 | 34,042 |
| 2018 | 79,700 |
| 2019 | 114,665 |
Black Cumin Production In metric Ton
| Date | Black Cumin |
| 2015 | 5,300 |
| 2016 | 23,800 |
| 2017 | 15,771 |
| 2018 | 7,586 |
| 2019 | 9,172 |
Cumin Production In metric Ton
| Date | Cumin |
| 2015 | 29,900 |
| 2016 | 51,800 |
| 2017 | 39,092 |
| 2018 | 58,144 |
| 2019 | 29,005 |
Other Industrial Corps Production In metric Ton
| Date | Other |
| 2015 | 83,610 |
| 2016 | 59,220 |
| 2017 | 67,066 |
| 2018 | 80,191 |
| 2019 | 114,984 |
Animal Production by product
Milk Products and its Derivatives Production in metric ton
Economic Indicators
Overview
The Syrian cconomy was growing rapidly before 2011, and as a result of the events that occurred in Syria during the past ten years, growth stopped in many sectors, and the real gross domestic product witnessed a deflation and decline, and consumer prices witnessed an increase compared to 2010, despite that GDP has been stable since 2017, with slight growth in 2018/2019, respectively.
Intensive work is being done to revitalize the agricultural sector, Which is an important factor of the economy and a driver for other sectors such as the industrial sector and the commercial sector. Syria is also characterized by an abundance of skilled manpower in various specializations, and this is a strong factor that can be relied upon in the recovery phase.
Gross Domestic Product
GDP In SYP -Billion
GDP Per Capita in SYP - Thousand
Growth In %
GDP At Constant Price By Sector – Base Year 2010
| By Sector – In % | 2015 | 2016 | 2017 | 2018 | 2019 |
| Agriculture, Forests & Livestock | 15% | 16% | 17% | 14% | 14% |
| Mining, Quarrying & Manufacturing | 10% | 9% | 11% | 14% | 14% |
| Building & Construction | 4% | 4% | 4% | 4% | 4% |
| Wholesale, Retail Trade & Repair | 13% | 14% | 15% | 16% | 16% |
| Transport, Storage & Communication Services | 17% | 18% | 18% | 18% | 18% |
| Finance, Insurance & Real Estate | 3% | 3% | 2% | 2% | 2% |
| Social & Personal Services | 6% | 6% | 5% | 4% | 4% |
| Government Services | 31% | 30% | 27% | 27% | 28% |
| Non-Profit Institutions | 0% | 0% | 0% | 0% | 0% |
GDP at Market Price – Base Year 2010
GDP in SYP -Billion
GDP Per Capita in SYP - Thousand
Growth in %
Consumer Price Index (CPI)
Consumer Price Index – Base Year 2010
| Date | 2010 | 2011 | 2012 | 2013 | 2014 | 2015 | 2016 | 2017 | 2018 | 2019 | 2020 * |
|---|---|---|---|---|---|---|---|---|---|---|---|
| CPI | 100 | 106 | 145 | 265 | 324 | 449 | 663 | 783 | 790 | 896 | 2,871 |
Inflation Rate (YoY) – in % – Base Year 2010
Food Inflation (YoY) – in % – Base Year 2010
Labour Force
Labour Force
Employed & Unemployed Persons
Employment Rate & Unemployment Rate
| Date | 2014 | 2015 | 2016* | 2017* | 2018* | 2019* |
| Employment Rate | 55% | 52% | 64% | 67% | 70% | 69% |
| Unemployment Rate | 45% | 48% | 36% | 33% | 30% | 31% |
Employed Persons
Unemployed Persons
Distribution of Labour Force by Age Group (2019)
| AGE Group | 15-24 | 25-29 | 30-39 | 40-44 | 45-49 | 50-59 | 60+ |
| Share % | 22.29% | 12.88% | 23.36% | 11.82% | 10.75% | 14.14% | 4.77% |
Employed Persons Distributions by Economic Activity (2019)
| Economic Activity | No. | Share % |
| 11% | 423,827 | Agricultural |
| 7% | 271,692 | Industry |
| 9% | 327,786 | Construction |
| 72% | 2,687,435 | Trade and Services |
Minimum Wages
SYP 92,970 (Dec.2021)
Foreign Trade
Exports and Imports (Goods) - in USD
Export and import (Goods) by Area - in USD – (2019)
Exports
Imports
Export and import by classification - in USD – (2019)
Markets
Foreign Exchange
Tax information
Corporate Tax Income
Salaries and wages Tax Income
| Corporate Income | Tax Rate |
| From SYP 0 to SYP 50,000 | 0% |
| From SYP 50,001 to SYP 200,000 | 10% |
| From SYP 200,001 to SYP 500,000 | 15% |
| From SYP 500,001 to SYP 1,000,000 | 20% |
| From SYP 1,000,001 to SYP 3,000,000 | 24% |
| Above SYP 3,000,000 | 28% |
| Joint Stocks companies (that offer more than 50% shares to the public) | 14% |
| Joint stock companies and limited liability companies | 22% |
| Banks and Financial Institutions Tax Income | 25% |
Salaries and wages Tax Income
| Salaries and wages | Tax Rate |
| Up to SYP 50,000 | 0% |
| From SYP 50,001 to SYP 80,000 | 4% |
| From SYP 80,001 to SYP 110,000 | 6% |
| From SYP 110,001 to SYP 140,000 | 8% |
| From SYP 140,001 to SYP 170,000 | 10% |
| From SYP 170,001 to SYP 200,000 | 12% |
| From SYP 200,001 to SYP 230,000 | 14% |
| From SYP 230,001 to SYP 260,000 | 16% |
| Above SYP 260,000 | 18% |
| Non-Regular Payments | 10% |
Holidays and Working Hours
National Holidays (2022)
| Date | Holiday Name | Notes |
| 01-01 | New Year | |
| 21-03 | Mother Day | |
| 17-04 | Independence Day | |
| 17-04 | Easter Sunday | |
| 24-04 | Orthodox Sunday | |
| 01-05 | Labour Day | |
| 02 to 04 May* | Eid Al-Fitr | To be determined according to the Hijri calendar |
| 06-05 | Martyrs' Day | |
| 09 to 12 July* | Eid Al-Adha | To be determined according to the Hijri calendar |
| 30-07 | Islamic New Year | To be determined according to the Hijri calendar |
| 06-10 | Tishreen Liberation Day | |
| 08-10 | Prophet Mohammad Birthday | To be determined according to the Hijri calendar |
| 25-12 | Christmas Day |
Working Hours
Government
Private Companies
Banks
Commercial Shops and stores
During Ramadan Month
Weekend